Understand your data through visual insight
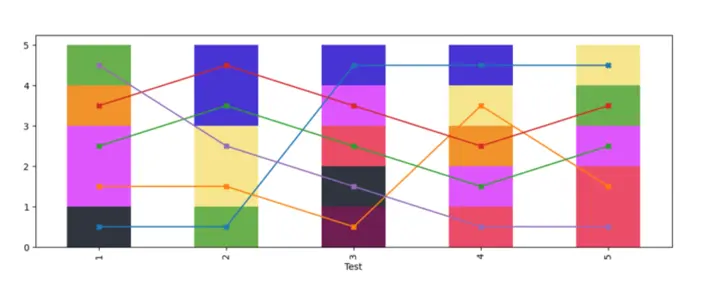
Our OrdinalPanelData service processes your longitudinal or cross-sectional datasets and visualizes the relationships between tests and categories.
By analyzing your data using our crossing minimization algorithm, we provide clear, publication-ready graphics that reveal the dynamics of your subjects over time.
Ready to visualize your data?
Upload your dataset and let our algorithm transform it into clear, publication-ready graphs.
You’ll receive your analysis and visual report via email.
Instructions
To generate your personalized visualization, please upload your dataset (Excel file) containing three columns:
- one for Subject,
- one for Test,
- and one for Category.
If your column names are different, please enter their exact names in the form below.
If your file already uses our default column names (Subject, Test, and Category), you can simply leave the fields as they are.
Once you upload the file and click Send, you’ll receive a PDF graph generated from your data directly to your email address.
After submitting, you’ll see a confirmation message:
✅ Successfully sent – your file was processed correctly
❌ Something went wrong – please try again or check the contact section below if the issue persists.